Reversal Candlestick Patterns: Pin Bar, Engulfing, Doji and How to Read Them in the Right Place
Author: Crypffalo Research · 13:55 11/10/2026
Read 4 common reversal patterns (pin bar, bullish engulfing, doji, shooting star) as a buyer–seller story, why location and volume matter more than shape, and how to turn a candle into a trade plan with stop loss and target.

Pin bars, hammers, engulfing candles, dojis… every trader learns these names early. Yet many people enter a trade just because they see "a nice hammer" and get stopped out right after. The reason is simple: a candlestick pattern only means something at the right location, with volume behind it, and once it is confirmed. This guide explains 4 common reversal patterns in the easiest way to remember them, by reading the story between buyers and sellers inside the candle, and then turns them into a trade plan with a stop loss and a target.
Quick summary
- Every candle tells a story: the open, high, low and close show which side won during that period.
- 4 reversal patterns to know: pin bar (hammer), bullish engulfing, doji and shooting star.
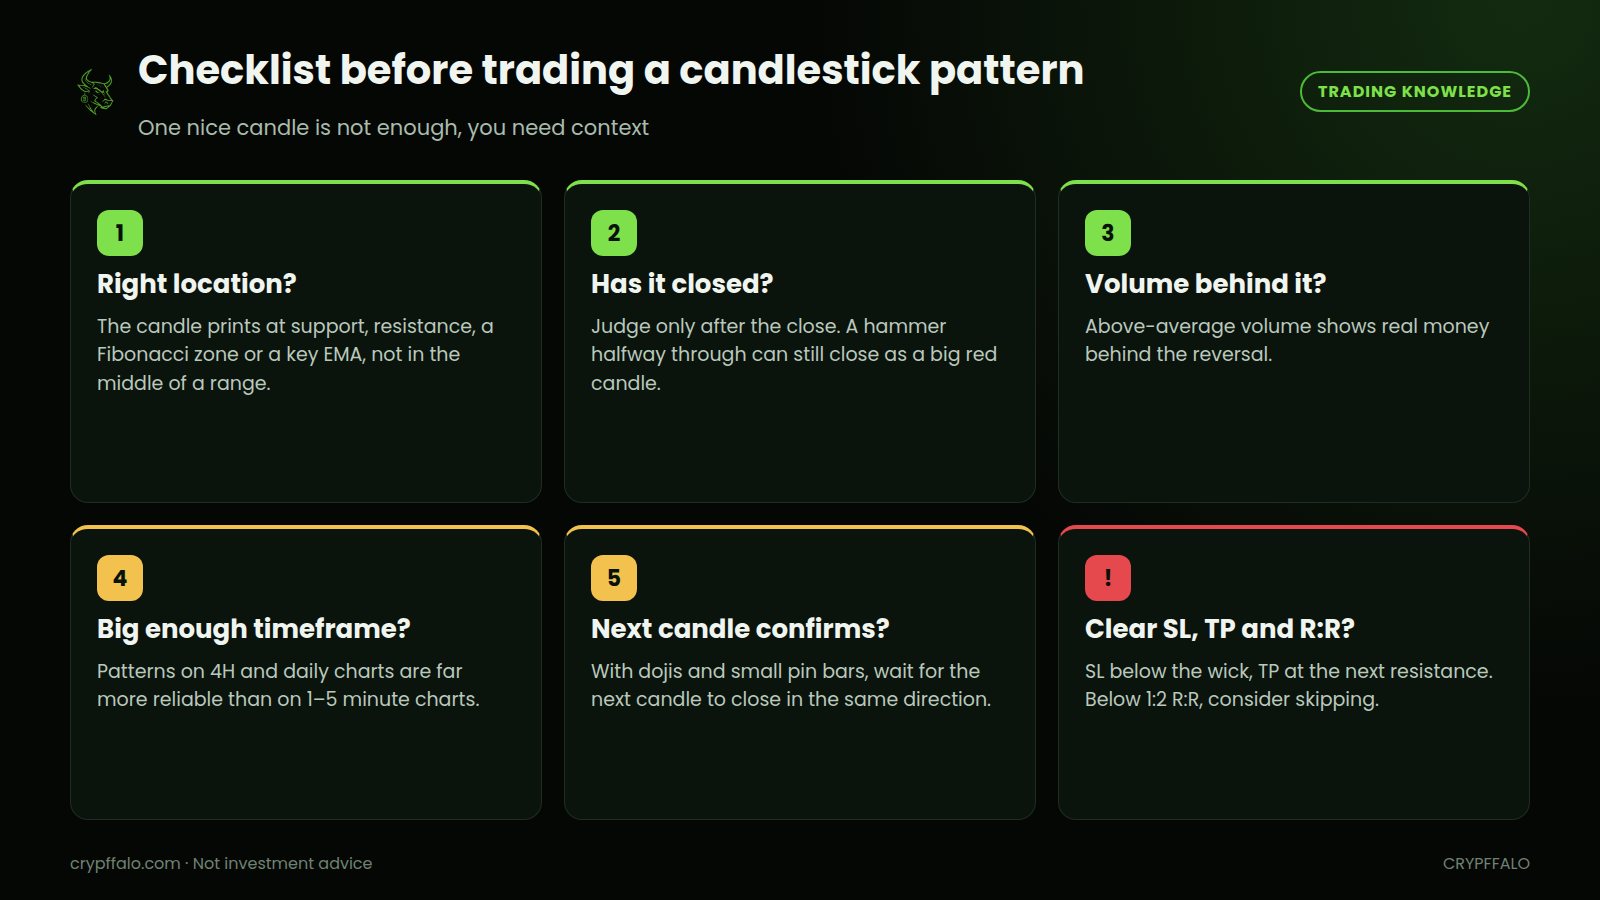
- A pattern is only reliable when it prints at support, resistance or a Fibonacci zone, the candle has closed, volume is above average, and it is on the 4-hour chart or higher.
- Put the stop loss below the signal candle's wick and the target at the next resistance. Below 1:2 R:R, consider skipping the trade.
1. Reading a candle: who won the session?
A Japanese candlestick has a body (from open to close) and wicks (where price traded but could not hold). A green candle closed above its open; a red candle closed below it.
- Long lower wick: price was sold down hard, but buyers pulled it back up. Sellers failed at the lows.
- Long upper wick: price was pushed up, but got sold back down. Buyers were rejected at the highs.
- Long body, short wicks: one side dominated the whole session.
- Tiny body: a stand-off; the market is undecided.
Once you see candles this way, you do not need to memorize dozens of pattern names. Just ask: which side just lost?
2. Four common reversal patterns
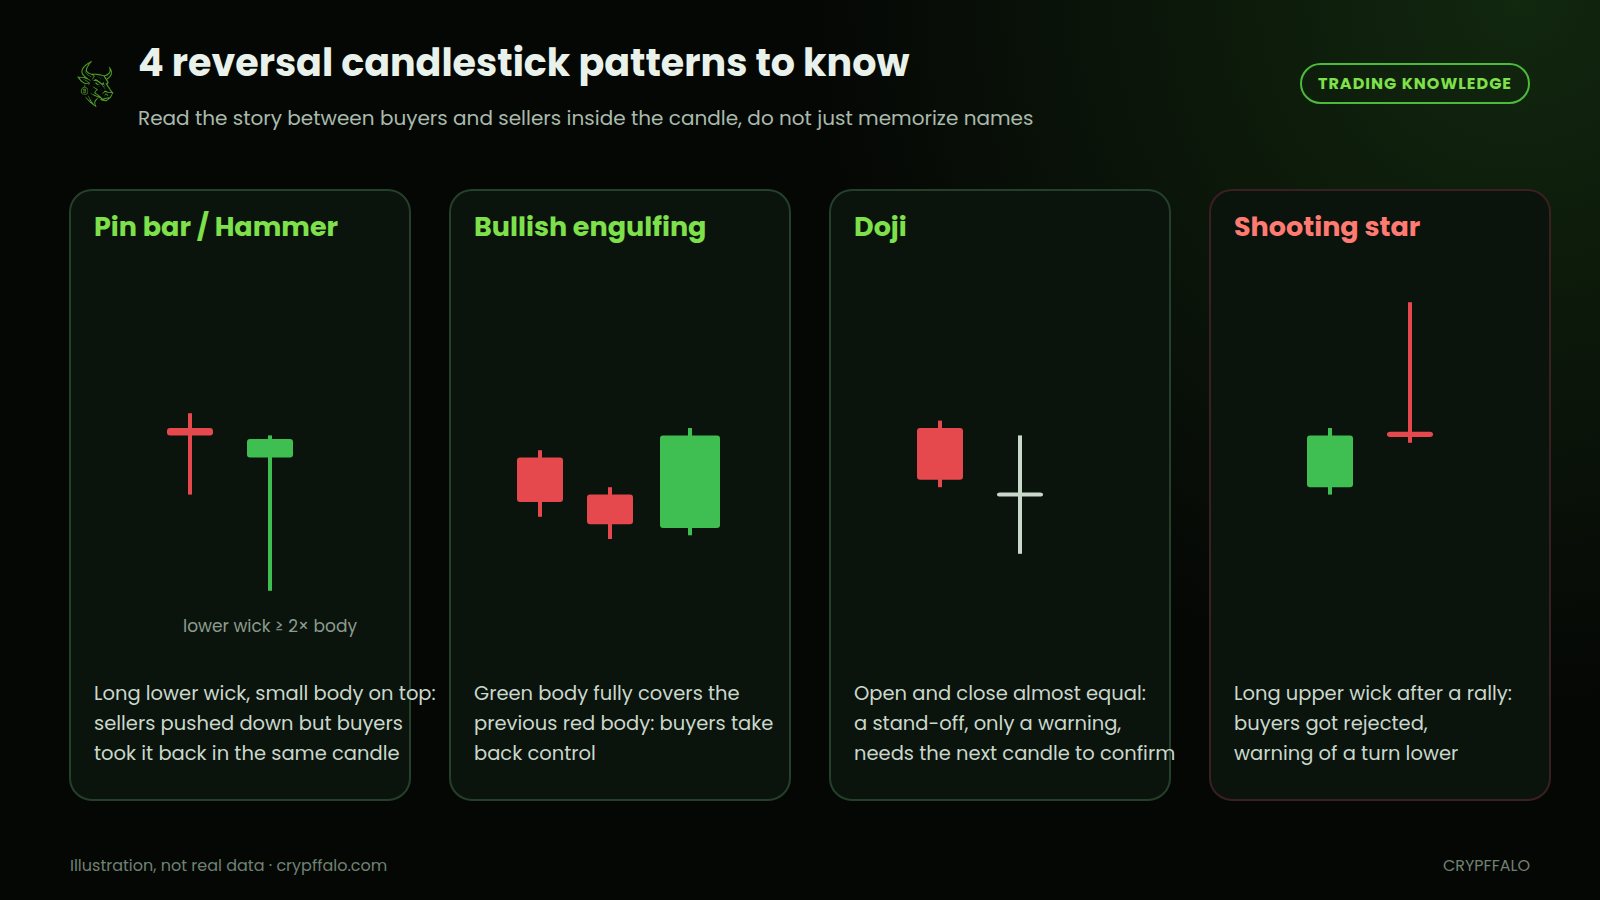
- Pin bar / hammer: a small body near the top and a lower wick at least twice the body. After a decline, at support, it shows sellers pushed price down but buyers bought it back within the same session. Wick length matters more than body color.
- Bullish engulfing: a green candle whose body fully covers the previous red body. It shows buyers decisively taking back control. The bigger the green body and the higher the volume, the stronger the signal.
- Doji: open and close are almost the same, so the body is nearly a line. This is only a sign of indecision, not a buy or sell signal. Always wait for the next candle to close to see who wins.
- Shooting star: the opposite of a hammer, with a long upper wick and a small body near the bottom, printed after a rally at resistance. It warns that buyers were rejected and price may turn lower. A bearish engulfing candle (a red body covering the previous green one) carries a similar message.
3. Location matters more than shape
This is the part most beginners skip. The same pin bar in two different places can mean completely different things.
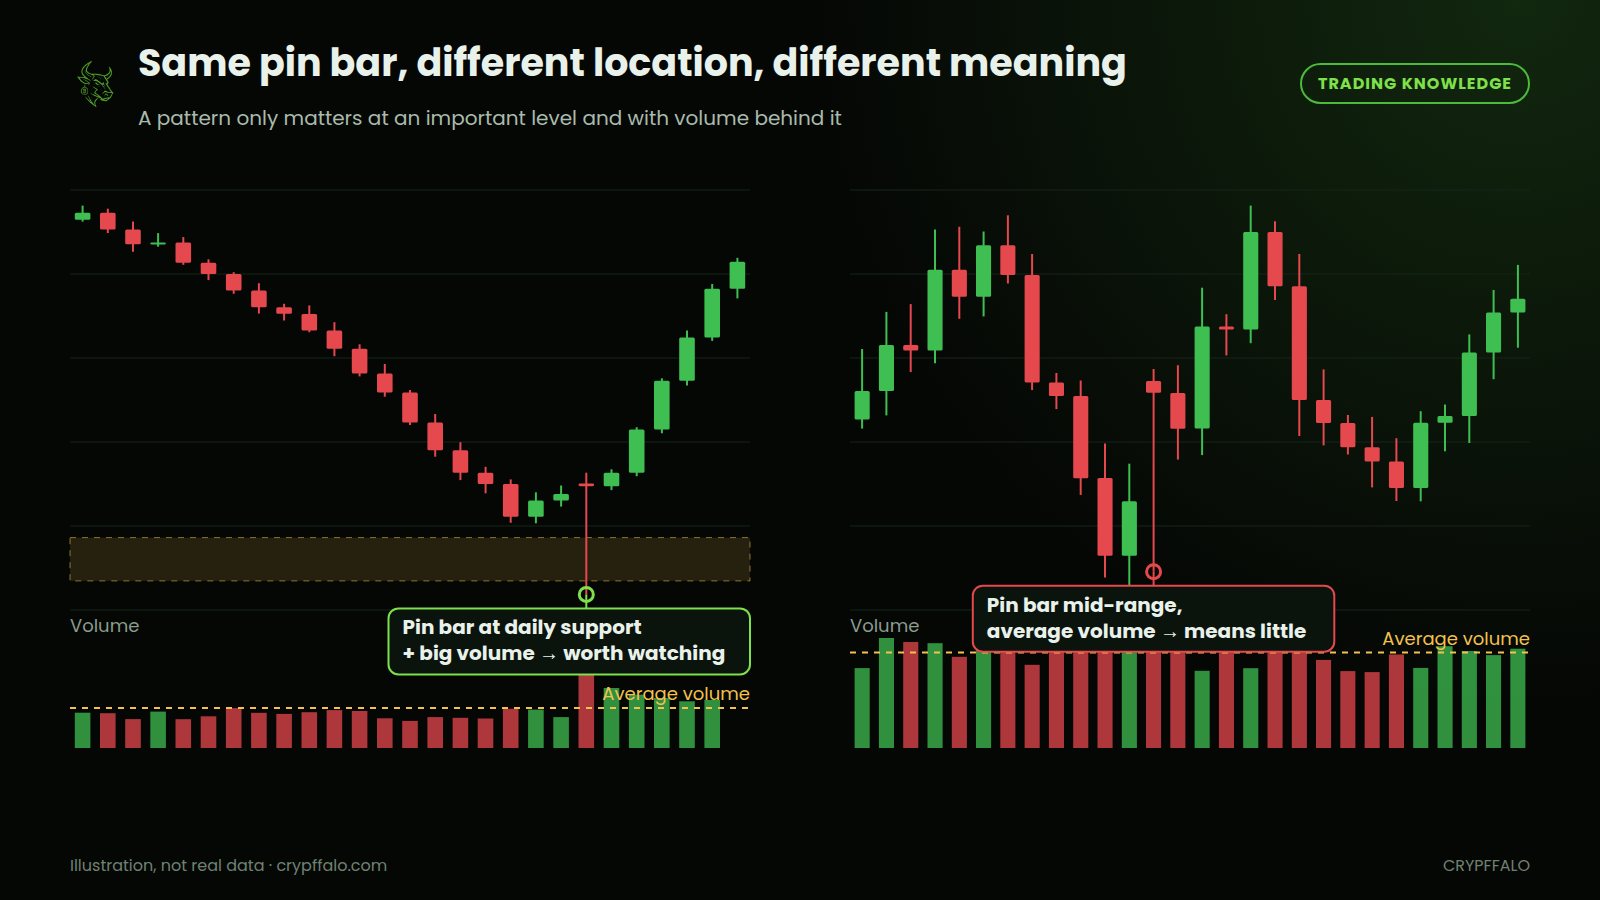
- A pin bar at an important support (an old low, the 0.5–0.618 Fibonacci zone, the EMA200): many buy orders wait there, and the long wick shows that buying actually showed up.
- A pin bar in the middle of a range: there is no reason for price to reverse there. The long wick might just be one big order filling.
- Volume is the "evidence": a signal candle with clearly higher volume than the 20-candle average shows real money behind it. Low volume means a weak signal. Read more in Volume and breakouts.
- Timeframe: patterns on the 4-hour and daily charts are far more reliable than on 1–5 minute charts, where noise and stop hunts are constant.
How to find the important price zones is covered in Support and resistance in crypto and Fibonacci retracement.
4. From a candle to a trade plan
Once you see a clean pattern in the right place, the next step is to plan before you click buy.
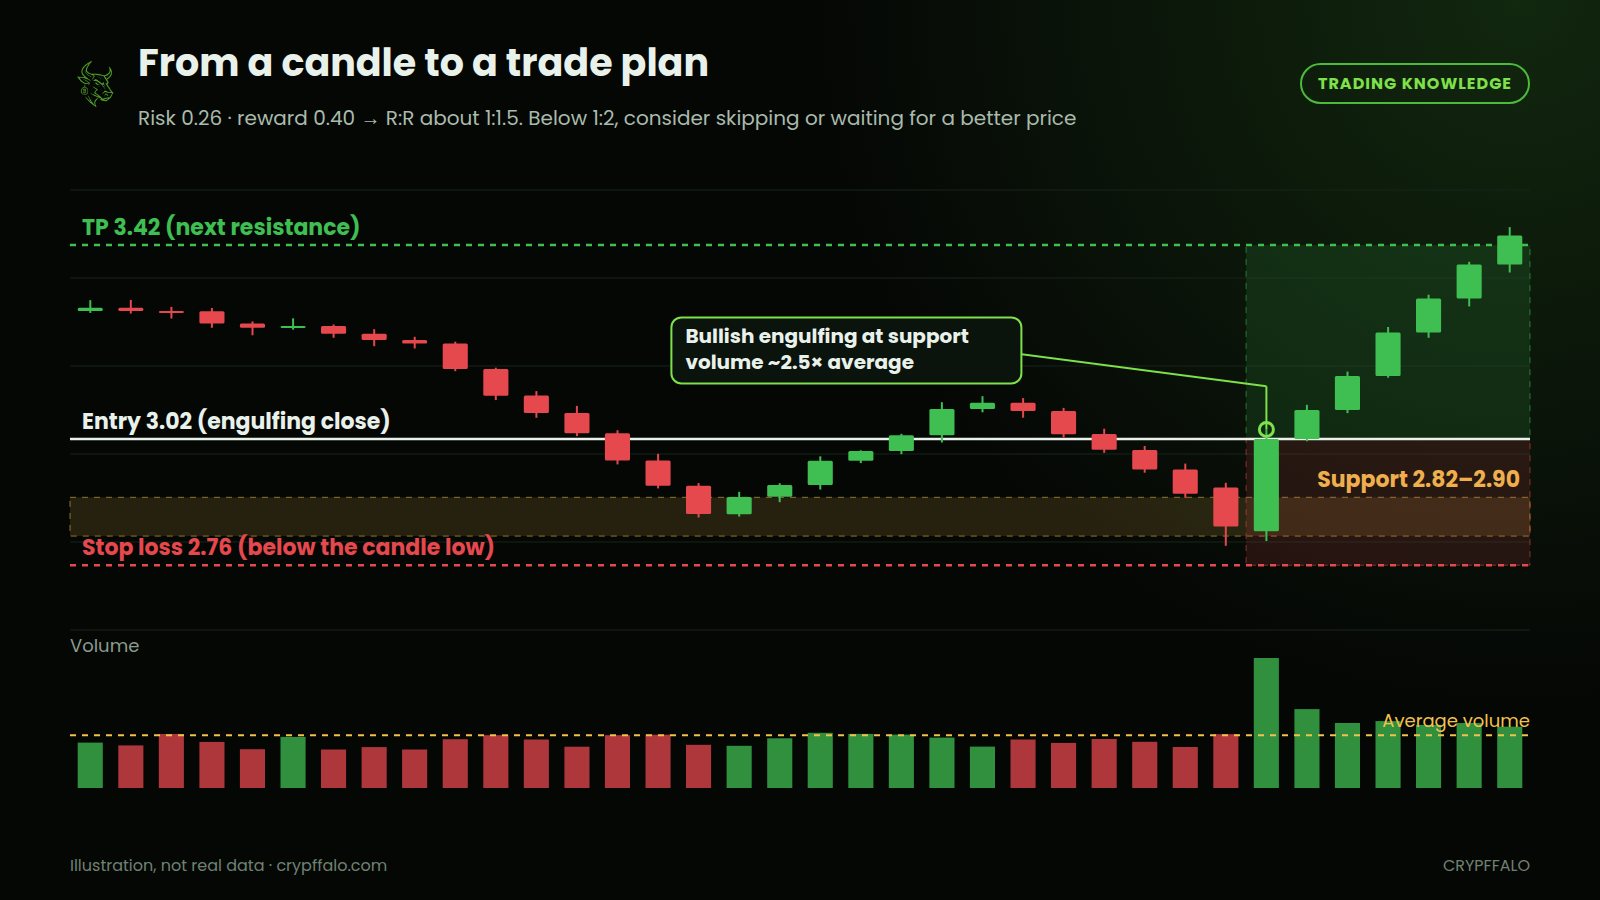
- Entry: enter once the signal candle has closed, or wait for a small pullback into the middle of the body for a better price.
- Stop loss: below the signal candle's lower wick (for a long), plus a small buffer to avoid getting swept. If price breaks that wick, the buyers have failed.
- Target: the nearest resistance or old high above.
- Work out R:R: in the example, risk is 0.26 and reward is 0.40, so R:R is only about 1:1.5. In this case it is better to skip the trade, or wait for price to come back closer to support so R:R reaches 1:2.
- Position size: size the trade from your stop distance so each losing trade costs only 1–2% of your account. Use the position size calculator.
5. Common mistakes
- Entering before the candle closes: a nice hammer halfway through the session can still close as a long red candle.
- Memorizing names, ignoring context: a doji in a strong downtrend does not mean the bottom is in.
- Trading against the higher timeframe: a hammer on the 15-minute chart while the daily chart is falling hard usually gives only a short bounce.
- Ignoring news: around CPI releases and rate decisions, candles can be huge and noisy. Check the Event calendar.
FAQ
Is a pin bar the same as a hammer?
A hammer is a type of pin bar that appears after a decline. "Pin bar" is the general name for a candle with one very long wick compared with its body, either a lower wick (bullish) or an upper wick (bearish).
Does the hammer's color matter?
Less than the wick length and the location. A green-bodied hammer is slightly stronger because it closed above its open.
Is a doji a reversal signal?
A doji only shows indecision. It becomes a signal when it appears at an important level and the next candle closes in a clear direction.
Conclusion
Candlestick patterns are the language of the chart, but one "word" alone does not make a sentence. Always ask three questions: where did the candle print, is there volume behind it, and has it been confirmed? Combined with support and resistance, Fibonacci and disciplined risk management, candlestick patterns can help you pick far better-grounded entries.
*For information and education only, not investment advice. Illustrations use sample numbers.*
Tags: Trading Knowledge, Technical Analysis, Candlestick patterns, Pin bar, Price action
Related articles
- What is Bitcoin dominance? How to read BTC.D to spot altcoin season (with examples)
- What Are Bollinger Bands? How to Read the Squeeze, %B and BandWidth (With Examples)
- What Is DCA? How to Dollar-Cost Average Into Bitcoin (With Examples)
- What Is MACD? How to Read Crossovers, Histogram and Divergence (With Examples)
- Fibonacci Retracement: How to Find Entry Zones on Pullbacks, Set Stop Loss and Targets
- Market Cap, FDV and Circulating Supply: Check Before Buying Crypto