What is Bitcoin dominance? How to read BTC.D to spot altcoin season (with examples)
Author: Crypffalo Research · 15:56 14/10/2026
Bitcoin dominance (BTC.D) is Bitcoin's share of total crypto market cap. This guide covers how it is calculated, how to read it with the BTC price, the stablecoin trap, a 4-step routine and worked examples.

Bitcoin dominance (BTC.D) is Bitcoin's share of the total crypto market cap. It shows whether money is concentrating in BTC or spreading into altcoins.
This guide explains how BTC.D is calculated, how to read it together with the Bitcoin price, the common stablecoin trap and a step-by-step routine, with worked examples. You can follow BTC.D, ETH.D and USDT.D, updated every 5 minutes, on our Bitcoin dominance today page.
Quick summary
- Formula: BTC.D = Bitcoin market cap ÷ total crypto market cap × 100%.
- BTC.D rising: Bitcoin is outperforming the rest, often in cautious markets or when institutional money flows into BTC.
- BTC.D falling: altcoins are outperforming BTC. This is a necessary but not sufficient condition for "altcoin season".
- Common trap: stablecoins sit in the denominator, so BTC.D can rise during a sell-off even while BTC falls.
- How to use it: always read BTC.D together with the BTC price, never alone as a buy or sell signal.
- Live numbers: the live BTC.D page shows the 24-hour and 7-day change and tells you which scenario the market is in.
1. What is Bitcoin dominance and how is it calculated?
A coin's market cap equals price × circulating supply. BTC.D divides Bitcoin's market cap by the combined market cap of every coin the data source tracks.
- Data sources: CoinMarketCap, CoinGecko and TradingView (ticker BTC.D) can differ slightly because each tracks a different list of coins.
- BTC.D is a ratio, not a price. It can rise because BTC rises, or because altcoins fall harder than BTC.
- If you are unsure how market cap works, read market cap vs FDV.
Example 1 (hypothetical): BTC $1,650B, Ethereum $350B, stablecoins $300B, other altcoins $500B. Total market $2,800B.
- BTC.D = 1,650 ÷ 2,800 ≈ 58.9%.
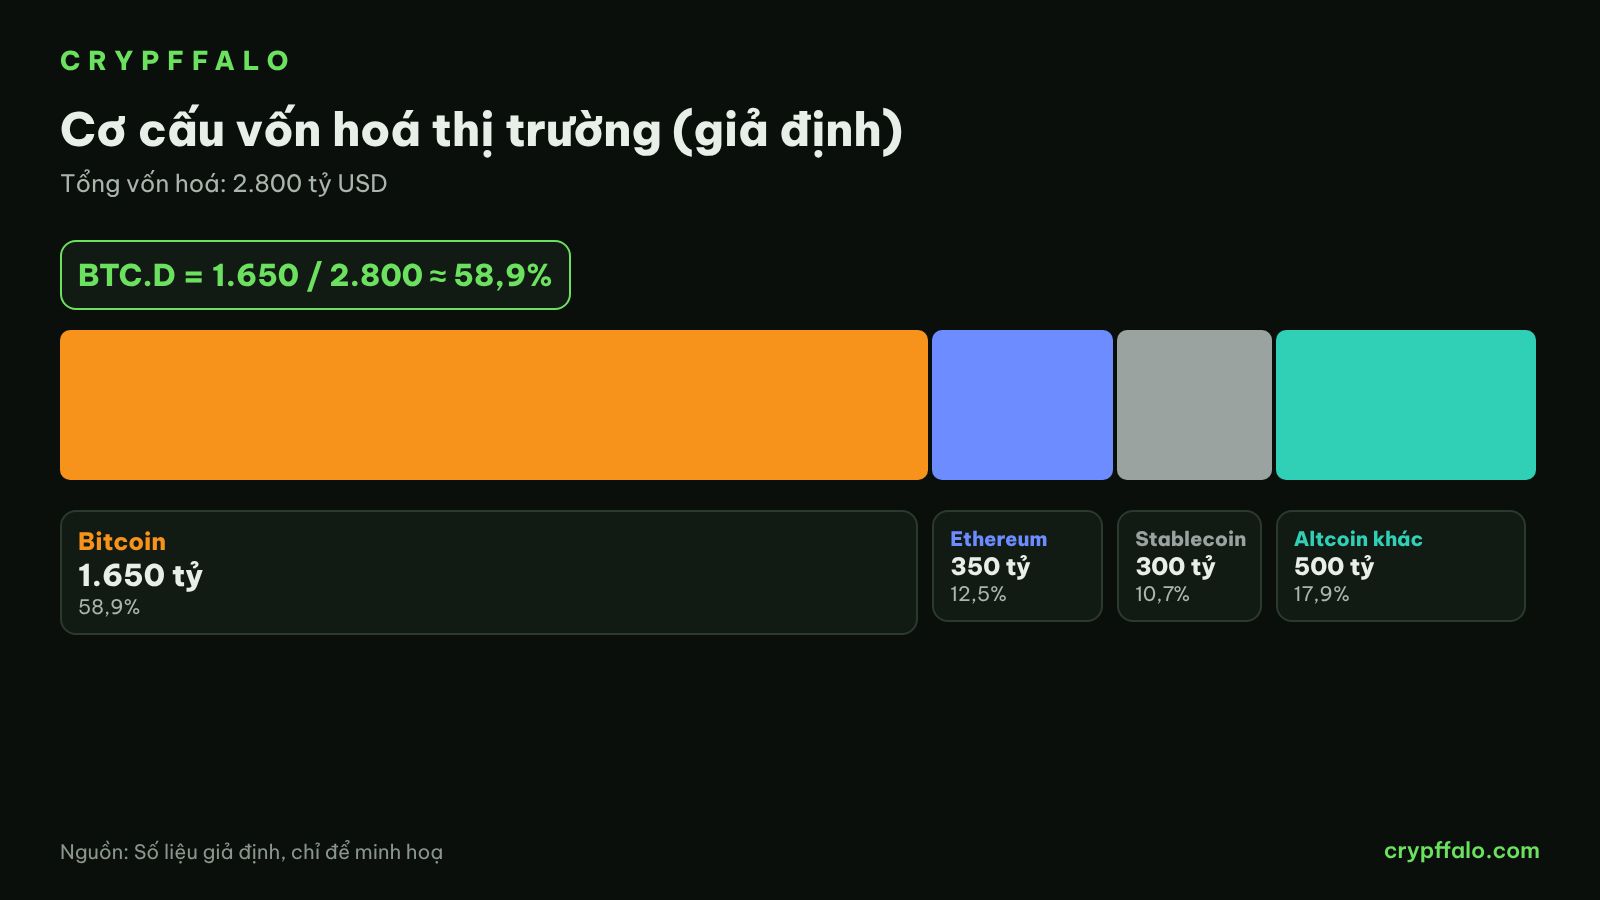
The current BTC.D, together with ETH.D and USDT.D, is on the Bitcoin dominance today page.
2. How to read BTC.D together with the Bitcoin price
Pair the direction of the BTC price with the direction of BTC.D and you get four cases:
- BTC up, BTC.D up: money flows mainly into Bitcoin; altcoins rise more slowly or stall.
- BTC up, BTC.D down: money is spreading into altcoins; risk appetite is growing.
- BTC down, BTC.D up: money is leaving the market; altcoins are sold harder than BTC.
- BTC down, BTC.D down: Bitcoin is weaker than altcoins. This is uncommon and usually short-lived.
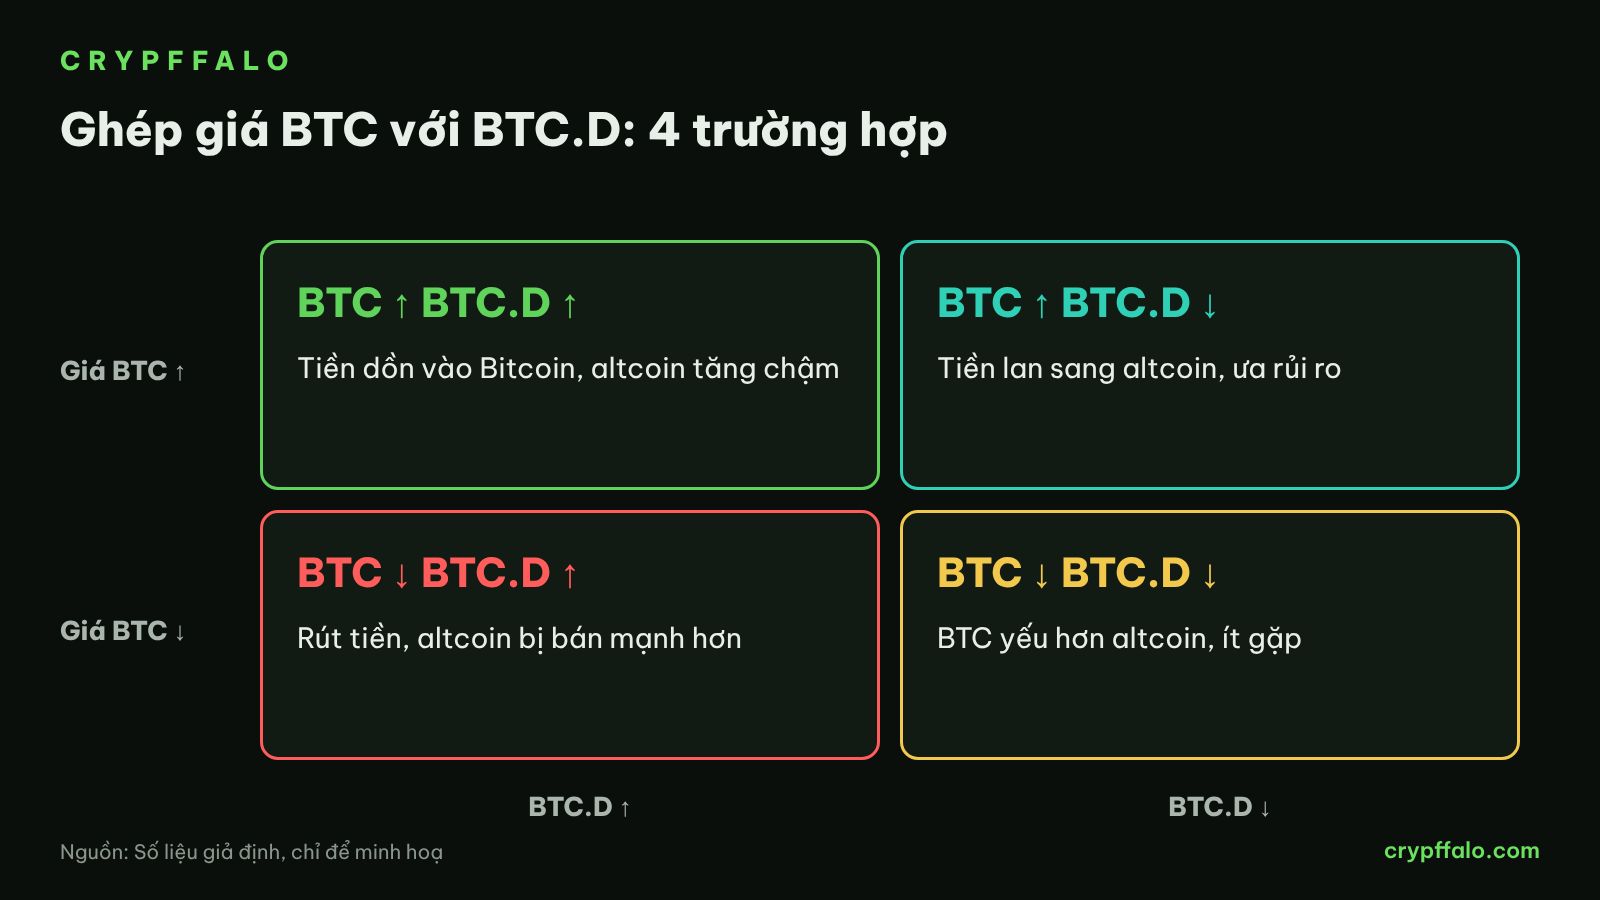
No need to check this by hand: the live BTC.D page shows these four cases and highlights the one the market is in now, based on the change in BTC.D and the BTC price.
Example 2 (hypothetical, continuing example 1): the rest of the market (altcoins + stablecoins) is $1,150B.
- Case A: BTC rises 5% to $1,732.5B and the rest stays at $1,150B. Total $2,882.5B, BTC.D ≈ 60.1%.
- Case B: BTC falls 5% to $1,567.5B and the rest falls 15% to $977.5B. Total $2,545B, BTC.D ≈ 61.6%.
BTC.D rises in both cases. But case B is a falling market that loses about $255B of market cap. Reading a rising BTC.D without checking the BTC price is an easy way to get it wrong.
3. The stablecoin trap and common mistakes
Stablecoins such as USDT and USDC keep a nearly constant market cap when the market swings. When prices fall, stablecoins take a larger share and distort BTC.D.
Example 3 (hypothetical, same market as example 1):
- BTC.D excluding stablecoins: 1,650 ÷ 2,500 = 66.0%.
- Market drop: BTC falls 10% to $1,485B, ETH and altcoins fall 20% from $850B to $680B, stablecoins stay at $300B.
- Standard BTC.D: 1,485 ÷ 2,465 ≈ 60.2%, up about 1.3 points.
- BTC.D excluding stablecoins: 1,485 ÷ 2,165 ≈ 68.6%, up about 2.6 points.
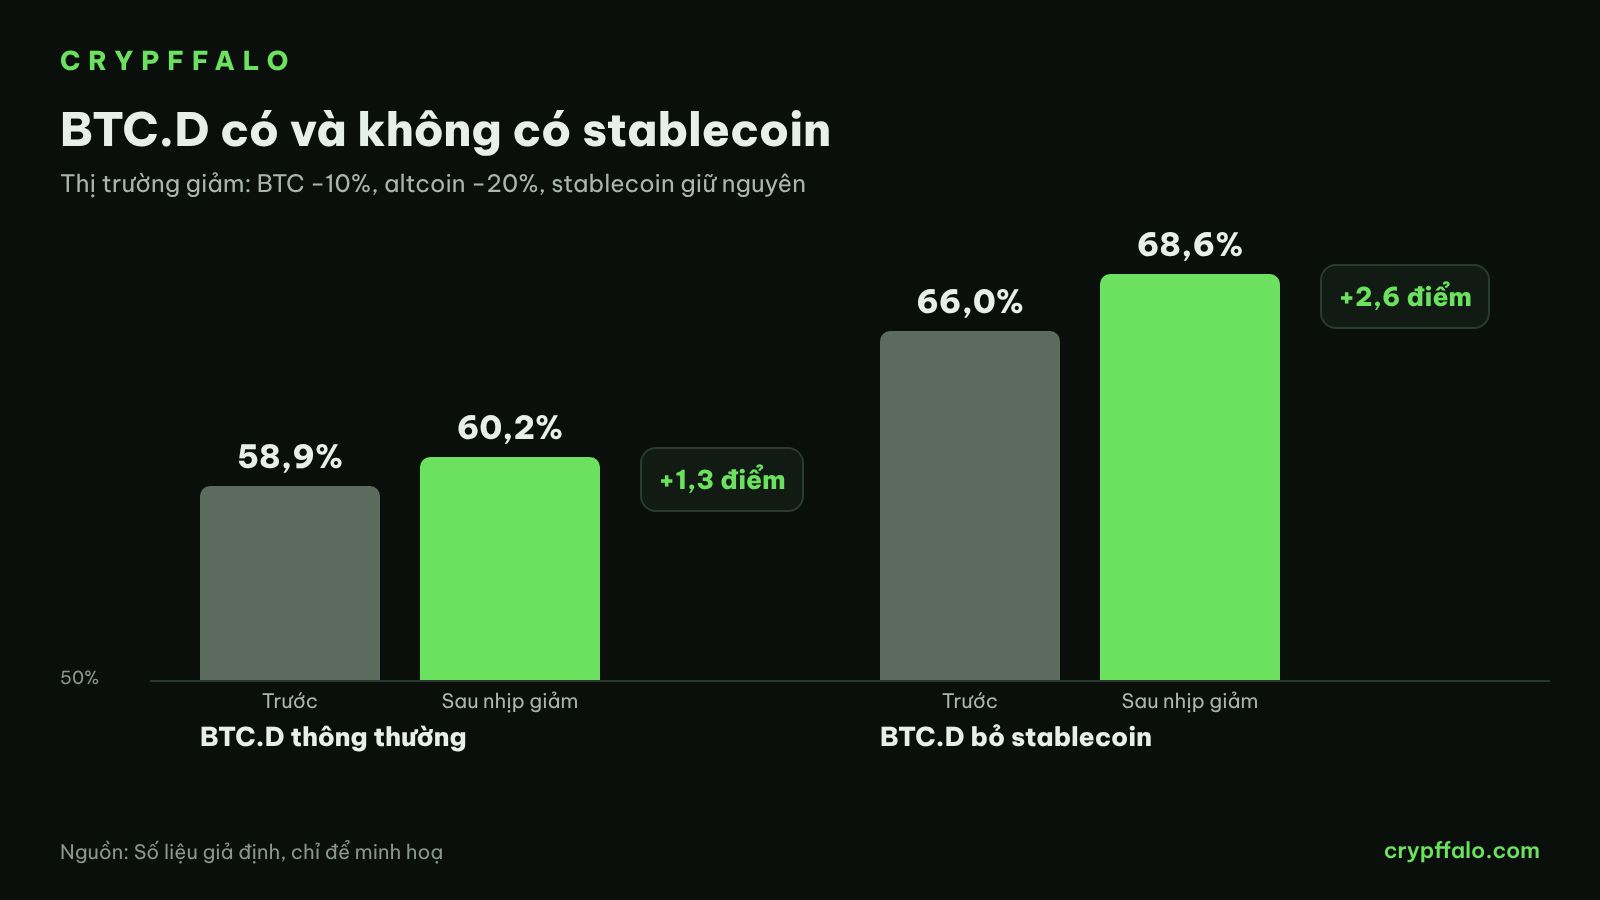
To avoid this trap, also check USDT.D (USDT's share). A rising USDT.D means money is moving into stablecoins, not rotating into altcoins. The Bitcoin dominance page shows USDT.D right next to BTC.D so you can compare.
Common mistakes:
- Buying altcoins as soon as BTC.D falls. BTC.D can fall simply because stablecoins grew.
- Ignoring Ethereum. ETH is large enough to move BTC.D, so check ETH/BTC too.
- Reading very short timeframes. A 0.3–0.5 point move within a day is usually noise. Weekly trends are more reliable.
- Comparing numbers across different sites. Each site tracks its own coin list, so stick to one source.
4. A step-by-step routine for using BTC.D
- Step 1: open the weekly BTC.D chart on one fixed source (for example the TradingView chart on the live BTC.D page). Mark support and resistance directly on the index.
- Step 2: put it next to the BTC price chart and identify which of the four cases in section 2 applies.
- Step 3: check USDT.D and ETH/BTC to tell whether money is leaving the market or just rotating. Both are on the Bitcoin dominance page. To see which coins money is flowing into, check spot and futures money flow.
- Step 4: adjust your BTC and altcoin weighting, combined with risk management. BTC.D is not an entry signal.
Illustrative case: BTC.D moves sideways for 3 weeks, BTC makes a new high and ETH/BTC starts rising. This suggests money may be spreading into large-cap altcoins. You still need to confirm volume and breakouts on each coin before entering.
5. What this means for reading the market now
- BTC.D is in a high range: in 2026 BTC.D stayed high, around 58.5% in early August according to CoinMarketCap data cited by Crypto Briefing.
- Institutional flows: money through ETFs and Bitcoin treasury companies goes mainly into BTC, so BTC.D is unlikely to fall sharply unless those flows reverse.
- During corrections: a rising BTC.D is not necessarily good for Bitcoin. Check whether total market cap is rising or falling first, then watch live liquidations and the long/short ratio to see where leverage is building.
The latest BTC.D and the current scenario are always on the Bitcoin dominance today page, updated every 5 minutes.
FAQ
What Bitcoin dominance level means altcoin season?
There is no fixed threshold. Many traders treat BTC.D below roughly 50%, with altcoins outperforming BTC, as a sign of altcoin season, but the link is not guaranteed.
Where can I check Bitcoin dominance?
On CoinMarketCap, CoinGecko or the BTC.D ticker on TradingView. On Crypffalo, the Bitcoin dominance today page brings BTC.D, ETH.D, USDT.D, ETH/BTC and a BTC.D chart together in one place. Pick one source and track it consistently.
Does a rising BTC.D mean the Bitcoin price will rise?
No. BTC.D is a ratio. It can rise even when the whole market falls, as long as altcoins fall harder than BTC.
What is USDT.D and why read it with BTC.D?
USDT.D is USDT's share of the total market. A rising USDT.D shows money moving into stablecoins. Reading it with BTC.D helps you tell money leaving the market apart from money rotating from BTC into altcoins.
*For information and education only, not financial advice. Examples use hypothetical numbers.*
Tags: Bitcoin dominance, BTC.D, Altcoin season, USDT.D, Crypto basics
Related articles
- What Are Bollinger Bands? How to Read the Squeeze, %B and BandWidth (With Examples)
- What Is DCA? How to Dollar-Cost Average Into Bitcoin (With Examples)
- What Is MACD? How to Read Crossovers, Histogram and Divergence (With Examples)
- Reversal Candlestick Patterns: Pin Bar, Engulfing, Doji and How to Read Them in the Right Place
- Fibonacci Retracement: How to Find Entry Zones on Pullbacks, Set Stop Loss and Targets
- Market Cap, FDV and Circulating Supply: Check Before Buying Crypto