Volume and Breakouts: How to Tell a Real Breakout From a Bull Trap
Author: Crypffalo Research · 17:10 06/10/2026
Real breakouts close above resistance on 1.5–2x average volume and hold the retest; bull traps break out on weak volume and reverse. Checklist and BTC, SOL examples.

What is a breakout and why does volume matter?
A breakout is when price moves through a resistance or support zone that has held price several times before. Volume (trading volume) shows how much real money is behind that move. In short: a real breakout usually has a candle closing above resistance on volume clearly above average, while a bull trap is often just a wick poking through resistance on weak volume, followed by a quick reversal.
Quick summary
- Real breakout = candle close above the resistance zone + volume of roughly 1.5–2x the average of the last 20 candles.
- Bull trap = price breaks above resistance but on low volume, with a long wick, then closes back below the zone.
- A safer approach: wait for the retest (price coming back to test the zone it just broke). A retest on low volume that holds is a good sign.
- Volume climax (abnormally high volume at the end of a steep rally) is often a sign of exhaustion, not a signal to chase.
- Always define your invalidation point in advance: a candle closing back below resistance means the breakout has failed.
1. Volume confirmation: how does volume confirm a breakout?
Resistance is where many sell orders are waiting: buyers from the previous top who want to break even, traders taking profit, and traders opening Short positions. For price to get through this zone, buyers have to "absorb" all that selling. That leaves a footprint on the volume bars.
- Compare with the average, not with a single candle: add a 20-period volume moving average (Volume MA 20) on TradingView or your exchange. The breakout candle's volume should be well above this line.
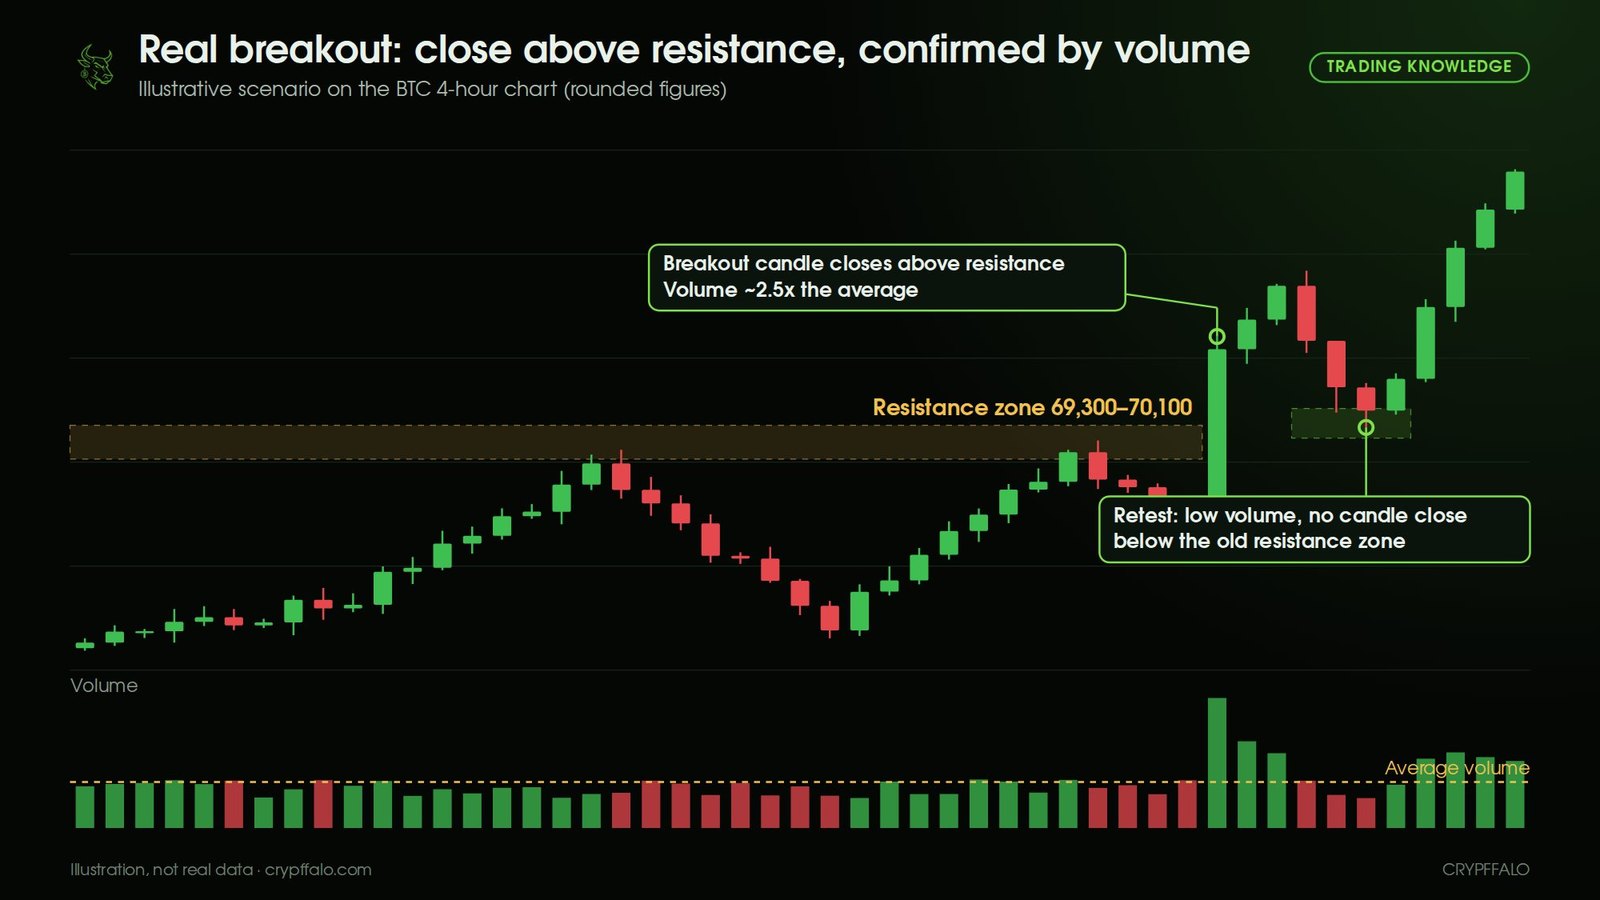
- Reference level: breakout-candle volume of about 1.5–2x the average or more shows real strength. Below-average volume is a weak signal; be cautious.
- Look at the following candles too: a strong breakout usually has 1–3 more bullish candles with volume still above average, not just a single candle.
- Only the close counts: a candle that runs above resistance and then pulls back within the same timeframe is not yet a breakout. Wait for the candle to close on the timeframe you trade (for example, the 4-hour chart).
Note: crypto volume is fragmented across many exchanges. When possible, look at volume on a major exchange (Binance) or aggregated volume, and compare it with that coin's own history rather than comparing different coins with each other.
2. Breakout and retest: wait for price to come back and test
After a breakout, price often comes back to test the old resistance zone. This is called a retest. If the zone holds, old resistance has turned into new support.
- Clean retest: price pulls back to the old zone on low volume (few people want to sell), with a lower wick or a hammer-like candle, and does not close deep below the zone.
- Bad retest: price comes back on heavy selling volume and closes below the zone. At this point the breakout has failed.
- Advantage of waiting for the retest: you open a position near support, so your stop loss is closer and your risk/reward ratio is better than chasing the breakout candle.
- Drawback: not every breakout gets a retest. Very strong breakouts can just keep running. Accepting that you will miss some setups in order to avoid traps is normal.
See how to place orders around support zones in Support and resistance in crypto: how to set entry, stop loss and targets.
3. False breakouts and bull traps: warning signs to watch for
A false breakout is when price moves through a zone and then quickly comes back. When this happens at resistance, buyers who chased the move get "trapped" at high prices, which is why it is called a bull trap. In the opposite direction, a fake break below support followed by a bounce is called a bear trap.
Common signs of a bull trap:
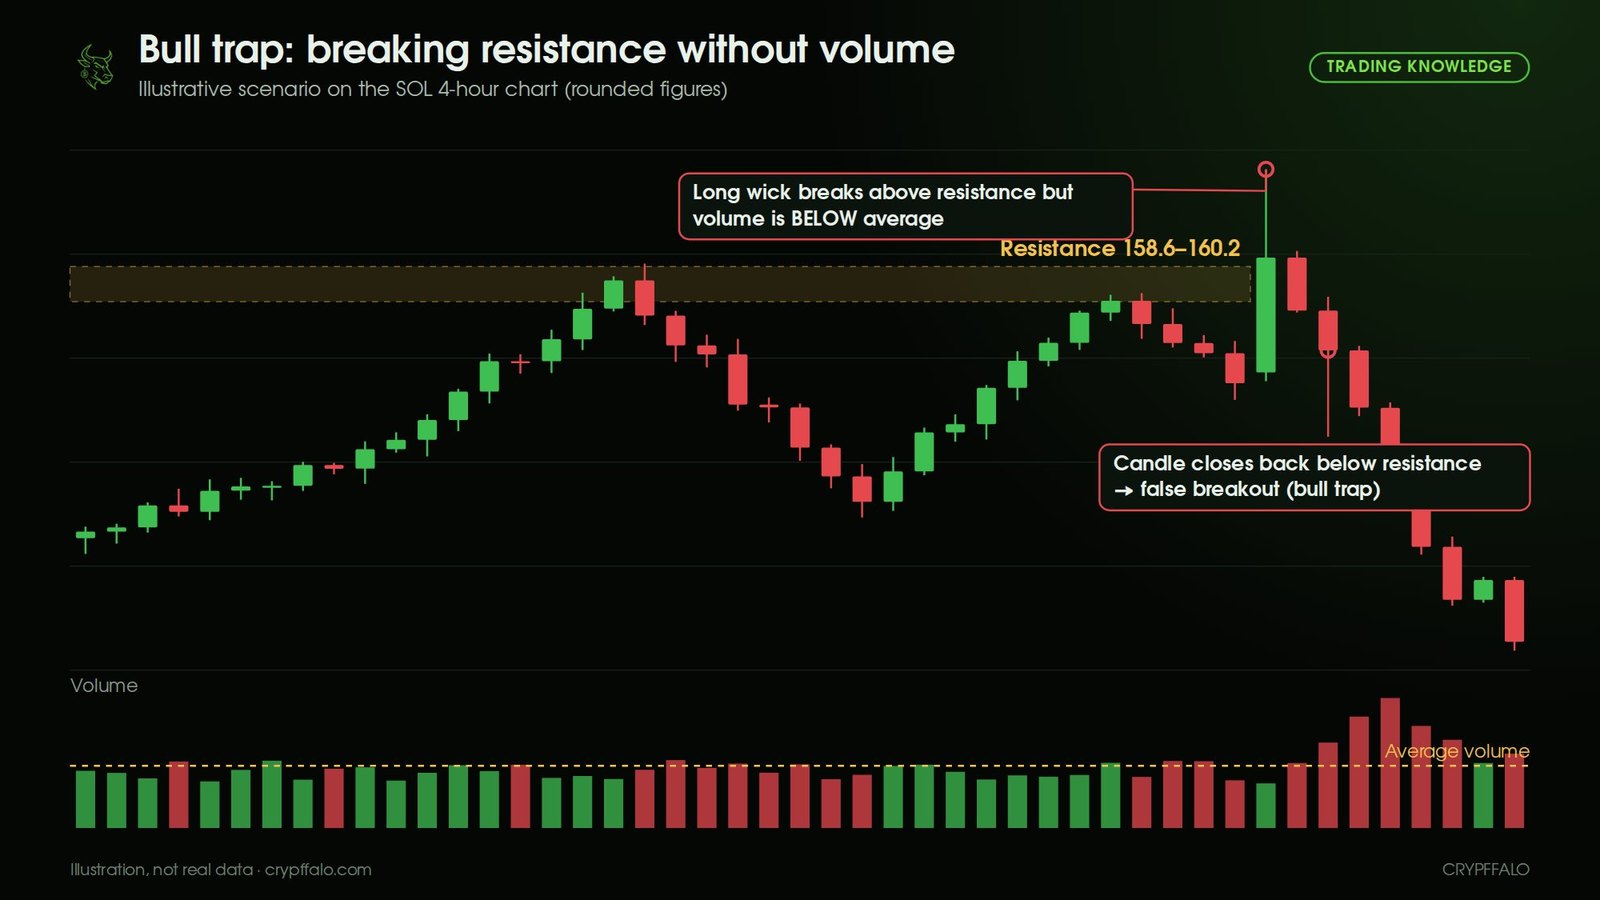
- Below-average volume on the candle that breaks resistance: there is no real money behind it.
- Long upper wick, small candle body: price gets sold off as soon as it clears the high.
- The next candle closes back below the zone: this is the clearest confirmation of a trap.
- Funding rate rising fast and many new Long positions opened right after the breakout: a sharp reversal sweep becomes more likely. You can track these metrics on the Funding & Open Interest page.
- Breakout against the higher timeframe: for example, the 1-hour chart breaks a high while the daily chart is still in a downtrend.
When a bull trap happens, the buyers who chased place stop losses just below resistance. Price falling through the zone triggers a wave of these sell orders, sometimes along with liquidations of leveraged Long positions, which makes price drop even faster. You can watch this happen live on the Real-time Liquidations page.
4. Volume climax: when high volume is actually a danger sign
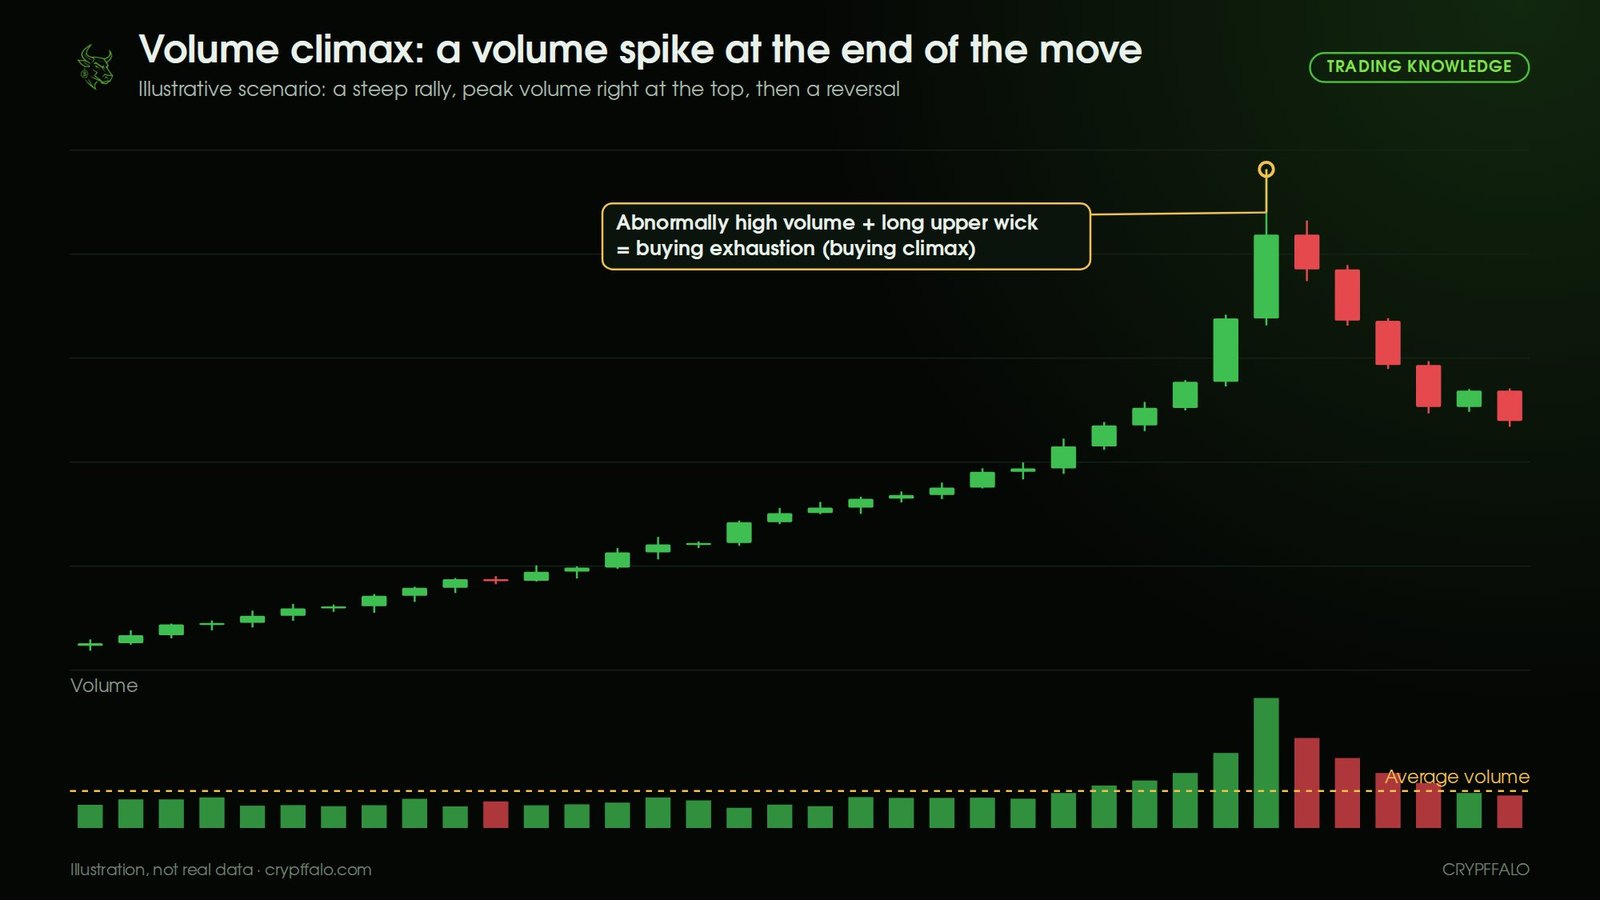
High volume is not always good. A volume climax (or buying climax) is when price has rallied steeply for some time and then a candle prints the highest volume in weeks with a long upper wick. This often means the last buyers have piled in (usually the FOMO crowd), while long-term holders take the opportunity to sell.
Telling confirmation volume apart from a volume climax:
- Location: confirmation volume appears right as price leaves a sideways accumulation range. A volume climax appears at the end of an extended rally.
- Candle shape: a confirmation candle usually closes near its high. A climax candle usually has a long upper wick and closes far from its high.
- What happens next: after confirmation, price holds above the breakout zone. After a climax, the following candles are often red with volume still high, meaning sellers are in control.
5. Illustrative examples with BTC and SOL
The two examples below are illustrative scenarios with rounded numbers to help you picture it, not data from a specific day.
- BTC, 4-hour chart, real breakout: BTC moved sideways below the 69,300–70,100 USD resistance zone for several days, getting rejected twice. Then a 4-hour candle closed at 71,900 USD on about 2.5x average volume. Two sessions later, price pulled back to around 70,050 USD on low volume, did not close below the zone, and then continued higher. A trader waiting for the retest could open a position around 70,200–70,500, with a stop loss on a 4-hour close below about 69,000.
- SOL, 4-hour chart, bull trap: SOL broke above the 158.6–160.2 USD resistance zone with a candle that wicked up to 164.6 but on below-average volume. Just two candles later, price closed back at 156.4 USD, then fell below 146 USD as stop losses and Long liquidations were triggered. Traders who waited for all the conditions (candle close + volume) avoided this trap.
To apply this to real data, open the Coin Data page on Crypffalo to see price, liquidations and whale positions for BTC and SOL in real time.
6. Checklist before opening a breakout trade
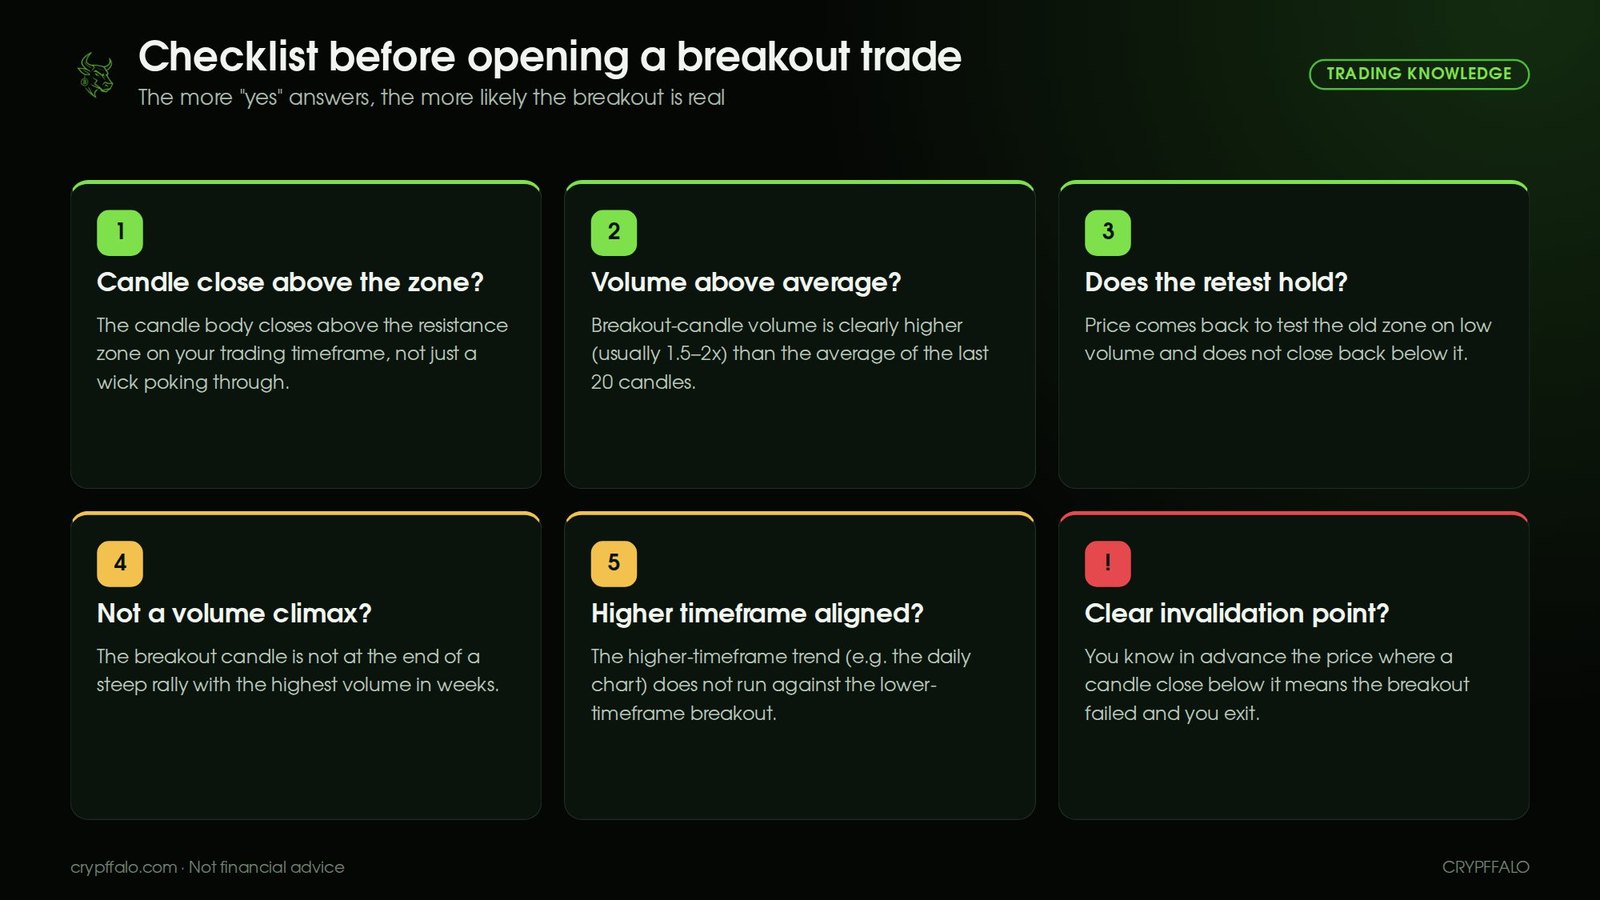
- Has the candle closed above the resistance zone on the timeframe you trade?
- Is the breakout candle's volume clearly above the 20-candle average?
- Can you wait for a retest on low volume?
- Is this the end of a steep rally (volume climax risk)?
- Is the higher timeframe pointing the same way?
- Do you know your invalidation point and the right position size? See how to calculate it in Risk management for beginners.
7. Common mistakes
- Buying as soon as price touches resistance, before the candle closes.
- Looking only at price and ignoring volume.
- Using high leverage on breakout trades, so even a brief sweep is enough to liquidate the account.
- Placing the stop loss too tight, right below resistance, exactly where the crowd places theirs.
- Relying on a single indicator. Combine volume with trend (EMA 20/50/200) and momentum (RSI).
Frequently Asked Questions
How much volume confirms a breakout?
There is no fixed number, but a common reference is breakout-candle volume of about 1.5–2x the average of the last 20 candles. More important than the exact number is that volume is clearly above that coin's own normal level.
What is a bull trap?
A bull trap is when price breaks above resistance, drawing many buyers to chase, then quickly closes back below the zone and drops, leaving the new buyers "trapped" at high prices.
Should you buy as soon as price breaks resistance?
For beginners, it is safer to wait for a candle to close above the zone on high volume, then wait for the retest. Buying the moment price touches resistance makes it easy to fall into a bull trap.
What is a retest?
A retest is when price comes back to test the zone it just broke. If old resistance holds as support (price does not close below it), the breakout is considered more reliable.
Is a volume climax a sell signal?
A volume climax is a warning that buying pressure may be exhausted, not an automatic sell order. Many traders use it to take partial profit or tighten their stop loss, and wait for further confirmation from the next candles.
Which timeframe should you check volume on?
The same timeframe you trade on. Breakouts on the 4-hour or daily chart are usually more reliable than on the 5–15 minute charts, because lower timeframes have more noise.
Note
This article is educational, and the examples are illustrative scenarios with rounded numbers. This is not financial advice. No indicator is 100% accurate; always set a stop loss and manage your capital carefully.
Tags: Trading Knowledge, Technical Analysis, Volume, Breakout, Bull trap
Related articles
- What is Bitcoin dominance? How to read BTC.D to spot altcoin season (with examples)
- What Are Bollinger Bands? How to Read the Squeeze, %B and BandWidth (With Examples)
- What Is DCA? How to Dollar-Cost Average Into Bitcoin (With Examples)
- What Is MACD? How to Read Crossovers, Histogram and Divergence (With Examples)
- Reversal Candlestick Patterns: Pin Bar, Engulfing, Doji and How to Read Them in the Right Place
- Fibonacci Retracement: How to Find Entry Zones on Pullbacks, Set Stop Loss and Targets