Support and Resistance in Crypto: Entry, Stop Loss and Targets
Author: Crypffalo Research · 17:00 06/10/2026
Support and resistance are zones, not lines. How to draw zones, use old highs and lows, read liquidity sweeps, trade break & retest, and plan entry, stop loss and target.

What Are Support and Resistance?
Support is a price zone where buying pressure is strong enough to halt a decline; resistance is a price zone where selling pressure is strong enough to halt a rally. The most important thing to remember: support and resistance are price zones, not lines accurate to the dollar. Opening a position just because price "touched the line," without a plan for entry, stop loss and target, is the fastest way to get stopped out.
Quick Summary
- Draw zones based on candle bodies and wicks, not a single line.
- Previous highs and lows are the most important zones because so many traders see them.
- Just above previous highs and just below previous lows there are usually many stop-loss orders, which is where liquidity sits. Price often "sweeps" through these areas before reversing.
- Break & retest: broken resistance often becomes new support; entering on a retest that holds is safer than chasing price.
- Every trade needs three things before you hit the button: entry, stop loss, target, plus a reward-to-risk ratio of at least about 1:2.
1. Price Zones Instead of a Single Price Level
The crypto market has a huge number of participants, each placing orders at slightly different levels, on top of high volatility and long candle wicks. As a result, price rarely stops at an exact number.
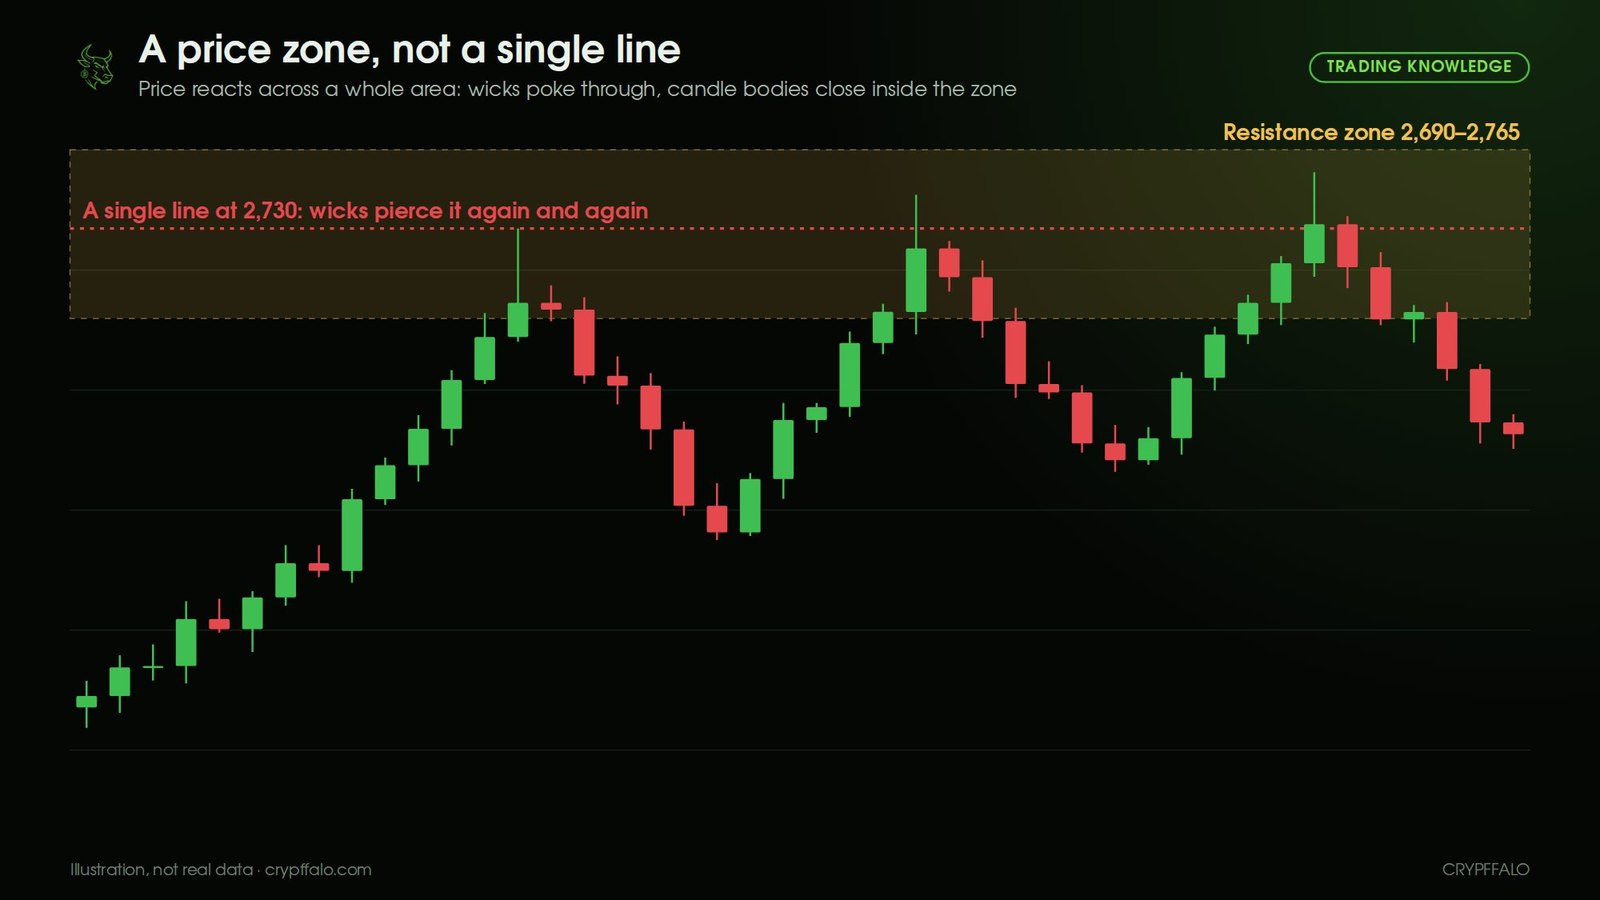
A simple way to draw a zone:
- Find an area where price has reversed at least 2–3 times.
- For a resistance zone, the lower edge follows the highest candle body close; the upper edge follows the highest wick. Do the opposite for a support zone.
- The more often a zone is tested and the stronger the reaction (high volume), the more important it is. But remember: a zone tested too many times often weakens, because the resting orders there get gradually absorbed.
- Prioritize zones on higher timeframes (daily, weekly) over lower timeframes.
2. Previous High/Low: Old Highs and Old Lows
The most recent highs and lows are levels that almost every trader can see on the chart.
- Old highs often act as resistance: those who bought the previous top want to sell at breakeven, and Short sellers place orders there.
- Old lows often act as support: those who missed buying the previous bottom want to buy, and short sellers take profit.
- Key levels to mark: the previous day's, week's and month's high/low, and the all-time high (ATH). In uncharted territory (above the ATH) there is no old resistance, so traders often use round numbers and extension levels.
3. Liquidity: Where Does It Sit?
In modern technical analysis, "liquidity" usually refers to clusters of resting orders, especially stop-loss orders and the liquidation prices of leveraged positions. Because most traders place stops just below old lows (for buys) and just above old highs (for sells), these areas hold a large number of orders ready to fill.
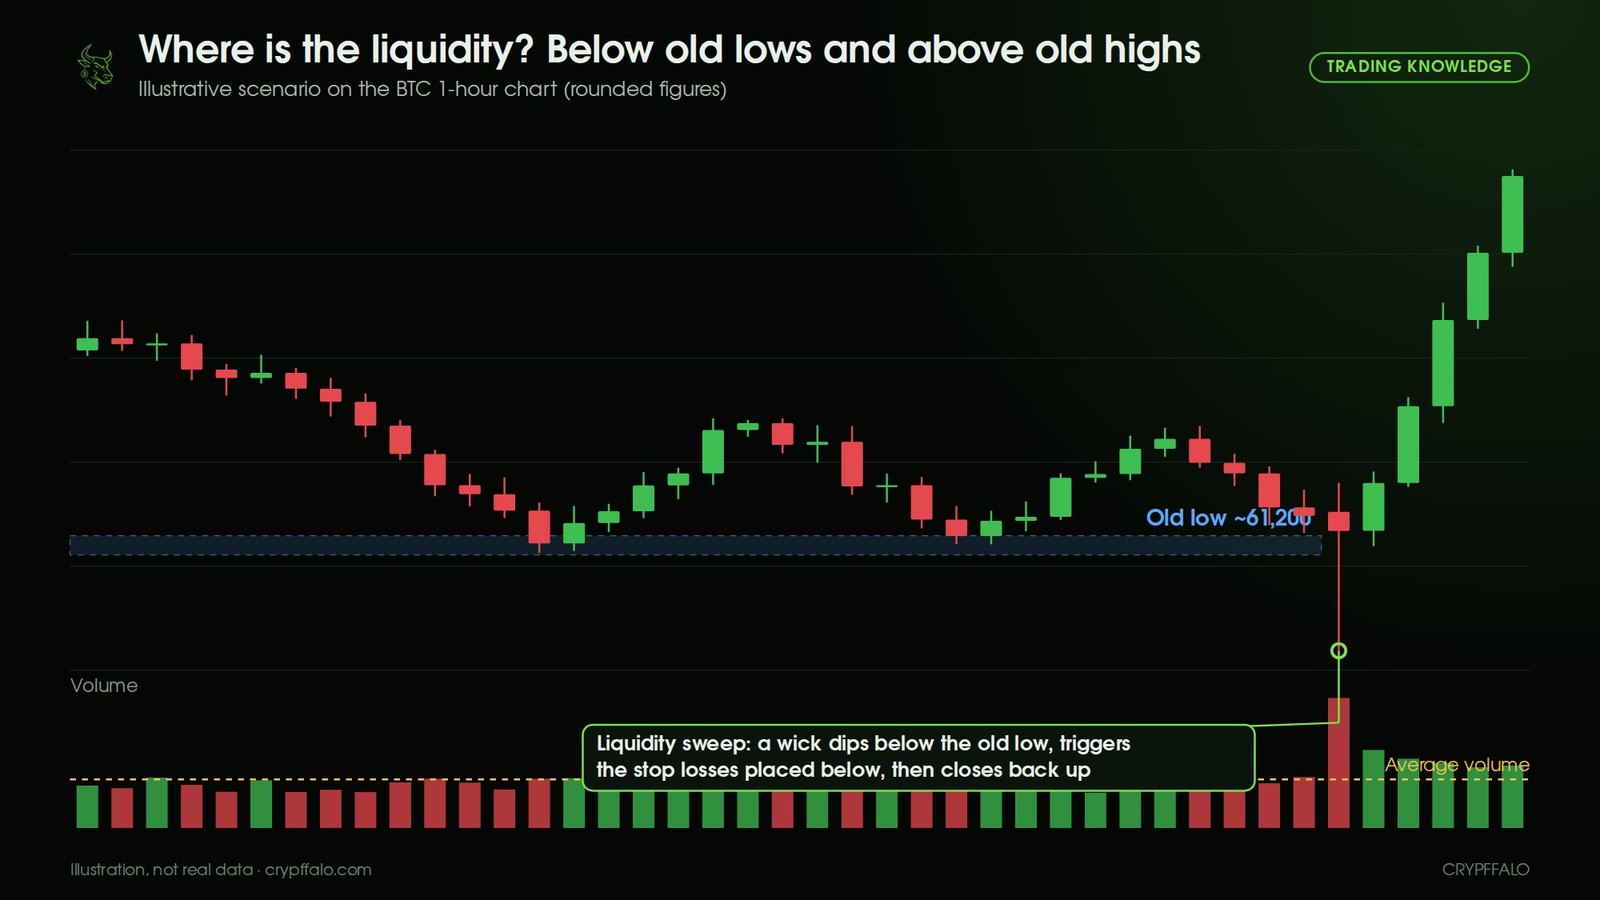
A common pattern is the liquidity sweep: price spikes quickly through an old low, triggers a wave of stop losses and liquidations, then closes back above the zone and reverses. This has practical implications:
- Don't place your stop loss right below the old low like the crowd does. Place it a reasonable distance from the zone (based on the coin's volatility), and reduce your position size to accommodate that distance.
- A sweep of the lows with high volume followed by a close back up can be a better reversal signal than the touch of support itself.
- You can watch these mass liquidations on the Real-Time Liquidations page and the Long/Short Ratio on the Exchange Long/Short page to see which side is crowded and vulnerable to a sweep.
4. Break & Retest: Old Resistance Becomes New Support
When a resistance zone is clearly broken (a candle closes above the zone on volume), the sellers there have been "absorbed," and traders who missed the move want to buy when price comes back. That is why old resistance often becomes new support. The reverse is also true: broken support becomes resistance.
- Break: a candle closes above the zone with above-average volume. Details on reading volume are in Volume and Breakouts: Real Resistance Break or Bull Trap.
- Retest: price returns to the zone on low volume, with candles rejecting lower prices.
- Confirmation: price bounces off the zone. This is when many traders open a position, with a stop loss below the zone.
5. How to Build Your Entry, Stop Loss and Target
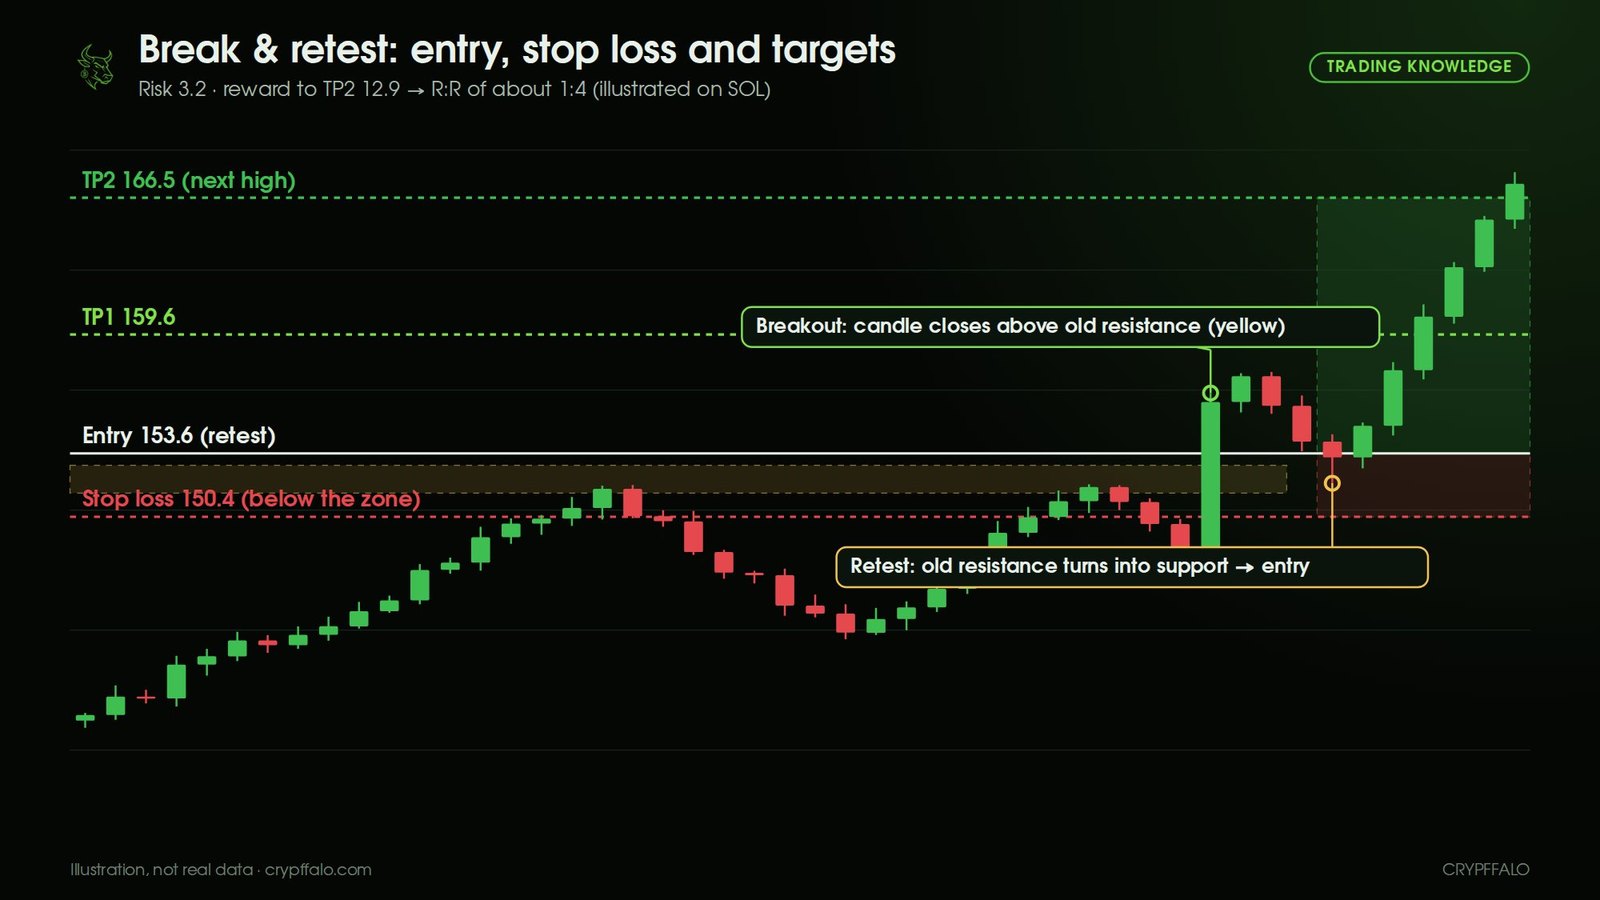
Take an illustrative example (rounded figures) on the SOL 4-hour chart, where the old resistance zone at 151.6–153.0 USD has just been broken:
- Entry: when price retests and holds the zone, open a position around 153.6 USD. You can split it in two: half at the upper edge of the zone, half if price dips deeper into the zone.
- Stop loss: place it below the zone, with a buffer for wicks, for example 150.4 USD. Reason: if price closes below the new support zone, the break & retest scenario is invalid.
- Target (take profit): TP1 at 159.6 (the nearest high), TP2 at 166.5 (the next resistance zone on the higher timeframe). Take partial profit at TP1 and move your stop loss to entry.
- R:R ratio: risk is 153.6 − 150.4 = 3.2 USD; reward to TP2 is 166.5 − 153.6 = 12.9 USD, or roughly 1:4. If R:R is below 1:2, skip the trade.
- Position size: determined by the distance to your stop loss, not by gut feeling. With VND 100 million in capital and a maximum risk of 1% (VND 1 million), a 2.1% stop-loss distance gives a maximum position size of about VND 48 million. The detailed formula is in Risk Management for Beginners.
You can preset your stop loss and take profit with an OCO order on the exchange; see the guide in Order Types on Binance Spot.
6. Common Mistakes With Support and Resistance
- Buying as soon as price touches support without waiting for a reaction.
- Drawing so many lines that the chart is cluttered and every line seems "important."
- Placing the stop loss right below the old low, where it is most likely to be swept.
- Having no target, so you take profit too early or let a winner turn into a loss.
- Ignoring the trend: buying at support in a strong downtrend has a much lower probability. Check the trend with EMA 20/50/200 first.
Frequently Asked Questions
What is the difference between support and resistance?
Support is a price zone below the current price where buying pressure tends to appear and halt a decline. Resistance is a zone above it where selling pressure tends to appear and halt a rally. When clearly broken, the two can swap roles.
Why draw zones instead of a single line?
Because crypto prices are highly volatile and many traders place orders at slightly different levels, price usually reacts across an entire area. Drawing zones helps you avoid being fooled by wicks and place more sensible stop losses.
Where should I place a stop loss when buying at support?
Place it below the entire support zone, with an extra buffer for wicks, rather than right below the old low. The distance to your stop loss then determines your position size so that each trade risks only about 1–2% of your total capital.
What is a liquidity sweep?
It is when price spikes quickly through an old high or old low, triggers the stop losses and liquidations sitting there, then quickly returns. A sweep of the lows followed by a close back up is sometimes a bullish reversal signal.
Is support stronger if it has been tested many times?
A zone that has held many times is an important zone, but each test consumes some of the resting buy orders there. That is why a zone tested too many times is often more likely to break.
What is a reasonable R:R ratio?
Many traders only take trades with a reward-to-risk ratio of about 1:2 or higher. With an R:R of 1:2, you only need to be right on about 33% of your trades to break even (before fees).
Note
This article is for educational purposes, and the examples are illustrative scenarios with rounded figures. This is not financial advice. Always check your own plan and only use capital you can afford to risk.
Tags: Trading Knowledge, Technical Analysis, Support and Resistance, Stop loss, Risk Management
Related articles
- What is Bitcoin dominance? How to read BTC.D to spot altcoin season (with examples)
- What Are Bollinger Bands? How to Read the Squeeze, %B and BandWidth (With Examples)
- What Is DCA? How to Dollar-Cost Average Into Bitcoin (With Examples)
- What Is MACD? How to Read Crossovers, Histogram and Divergence (With Examples)
- Reversal Candlestick Patterns: Pin Bar, Engulfing, Doji and How to Read Them in the Right Place
- Fibonacci Retracement: How to Find Entry Zones on Pullbacks, Set Stop Loss and Targets